Aspro Plots
Source Observability
observability.svg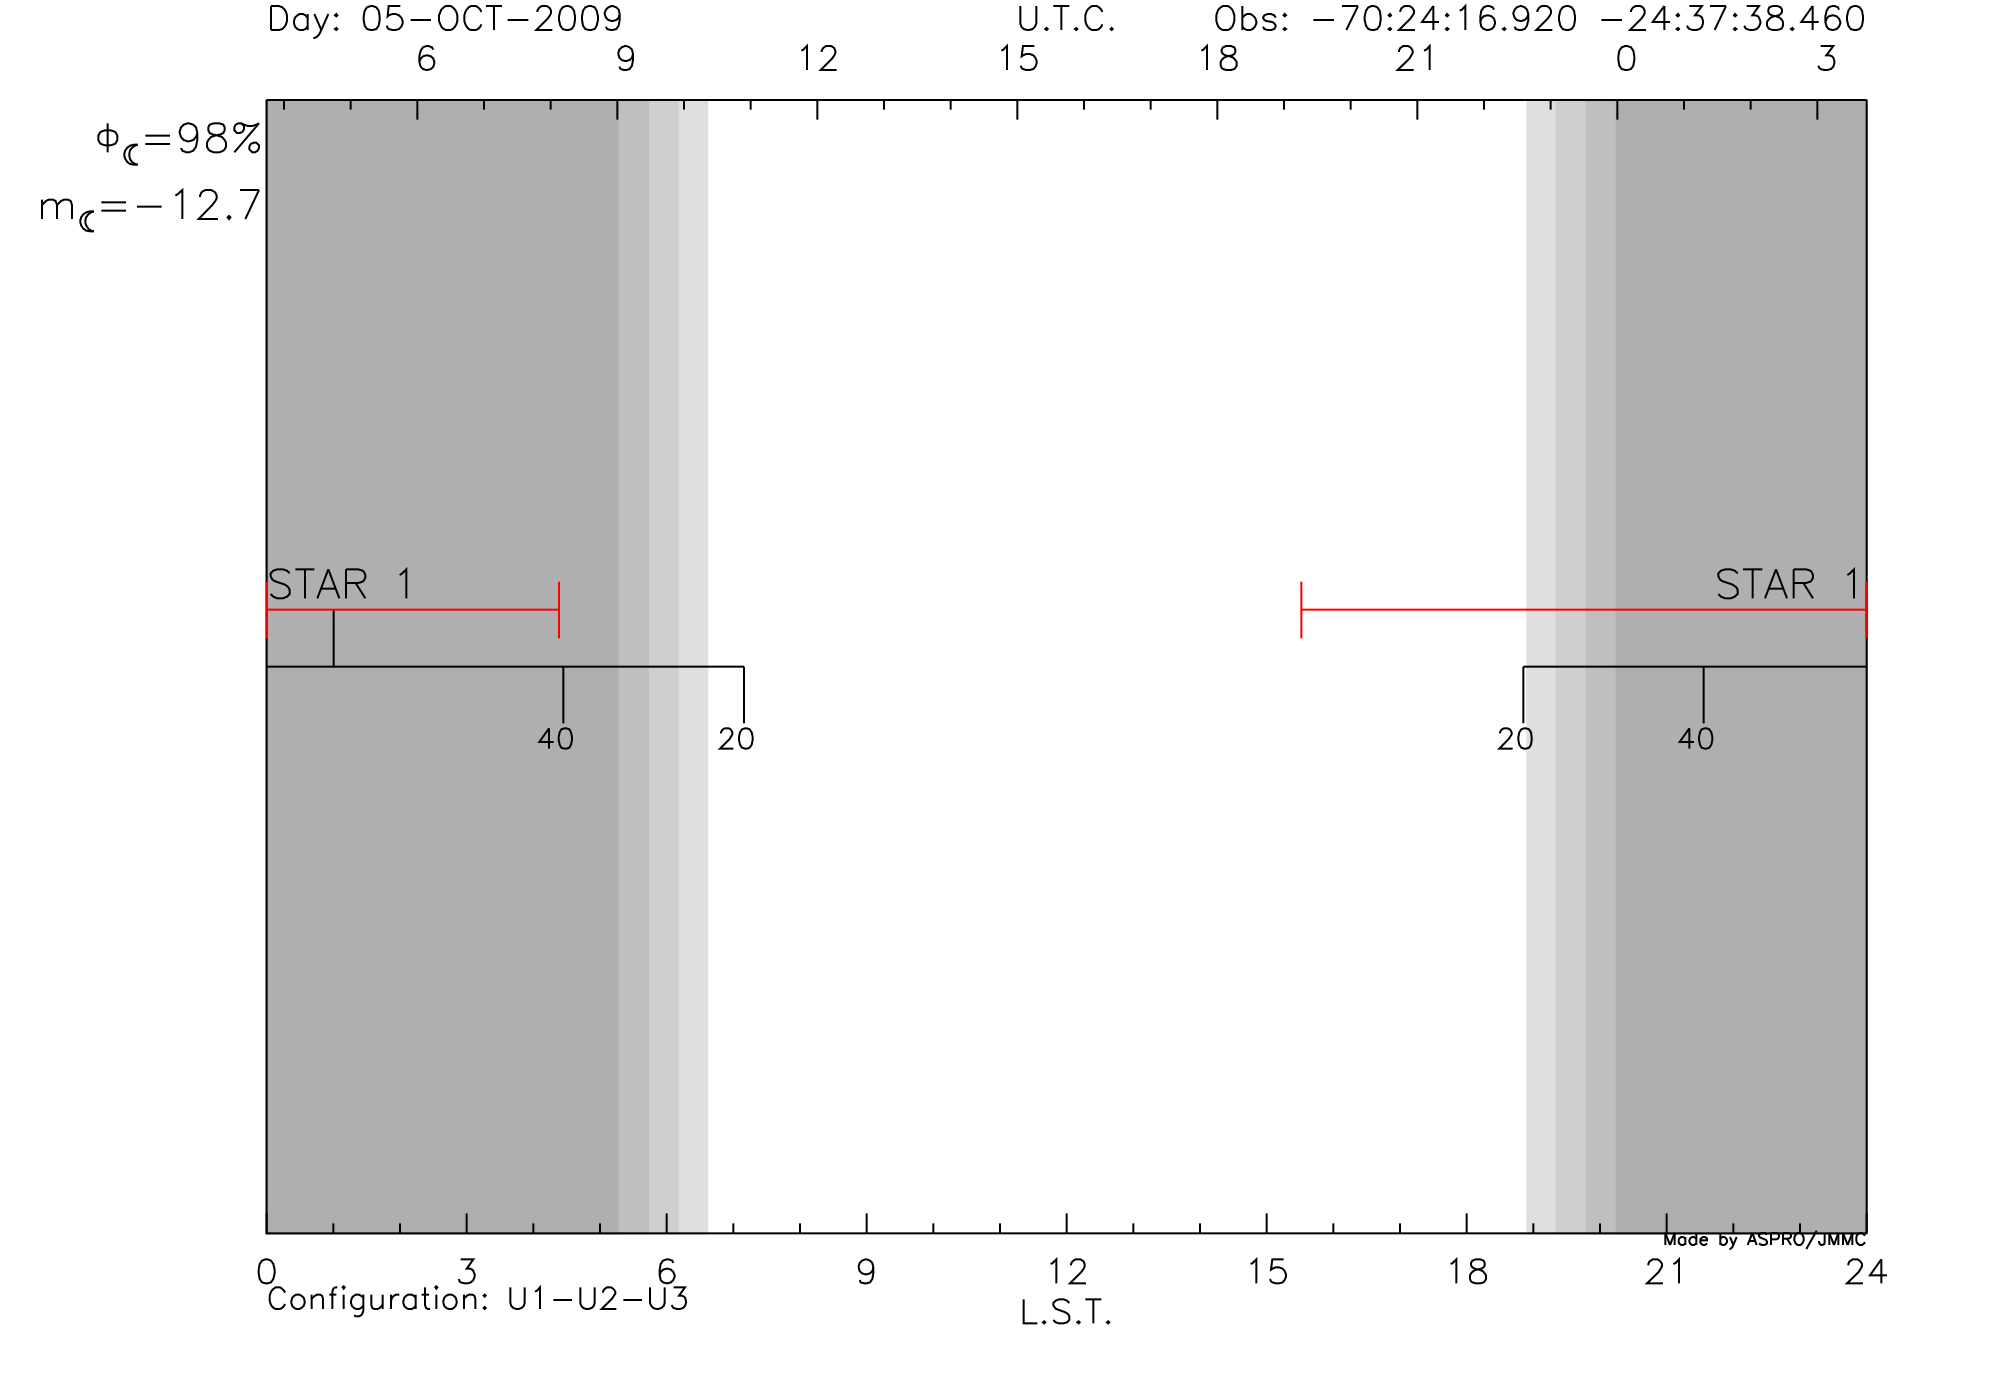 Data to plot:
 - Twilight zones ( Time1,LuminosityLevel1 tuples ) (Do we need the detail of Nautical, Civil and Astronomical Twilight levels?)
- For each Source:
- Source Name
- DL availibitity zones
- Elevation 20 40 or User defined MinElevation
- Optionnals:
- Display TimeStamp of DL availability zones (UT)
- UTC Time
- Date of observation
- Observatory location
- Interferometer configuration (STA1-STAi...-STAn) [ Pops]
- Moon informations
Baseline Limits
baseLineLimits.svg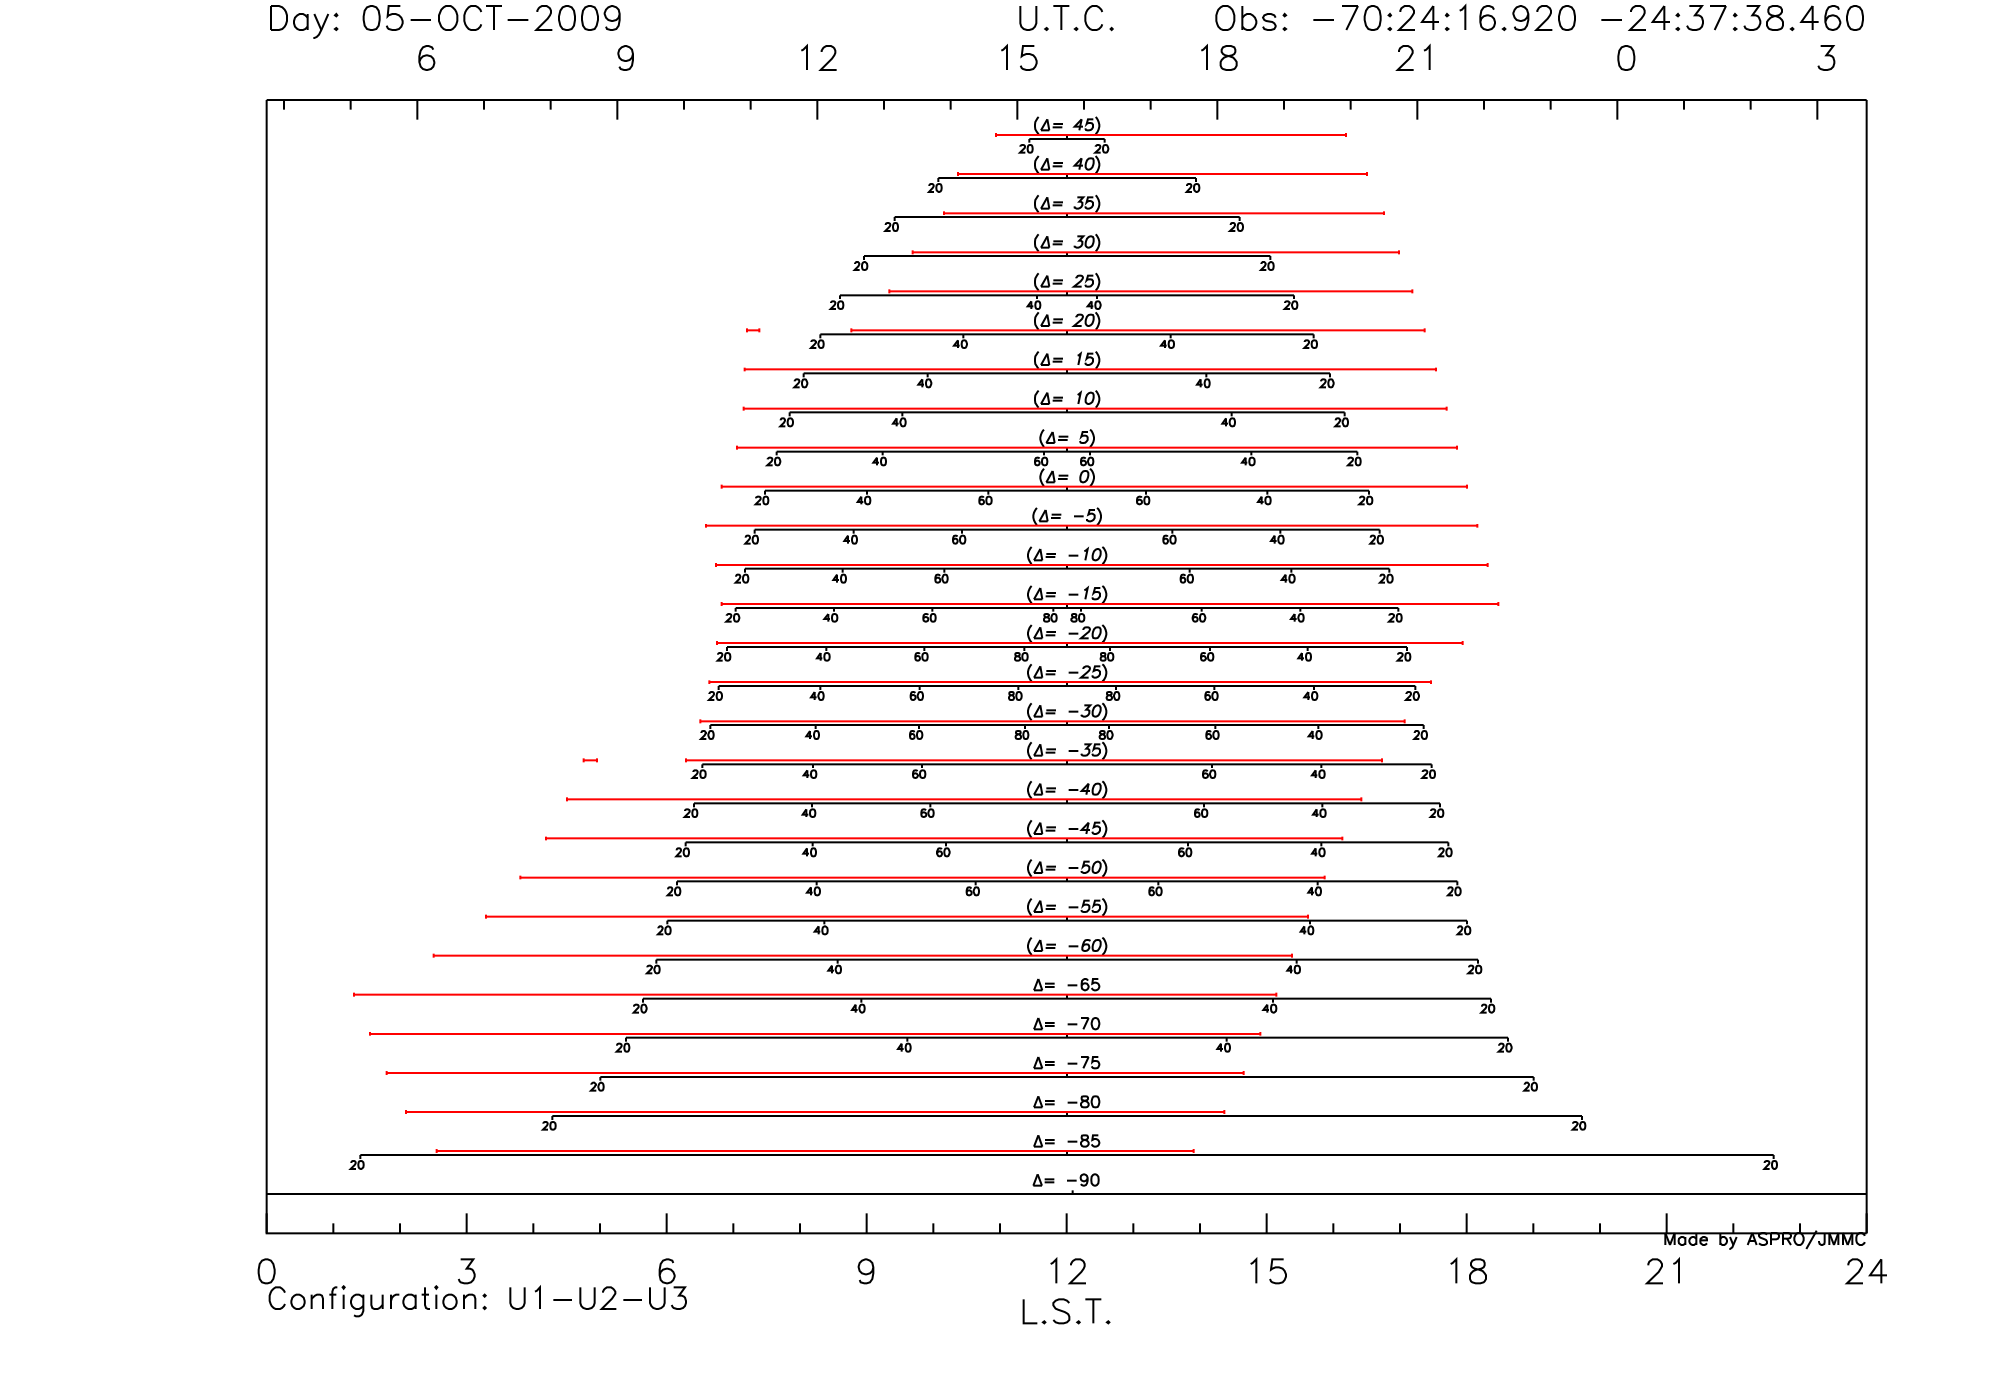
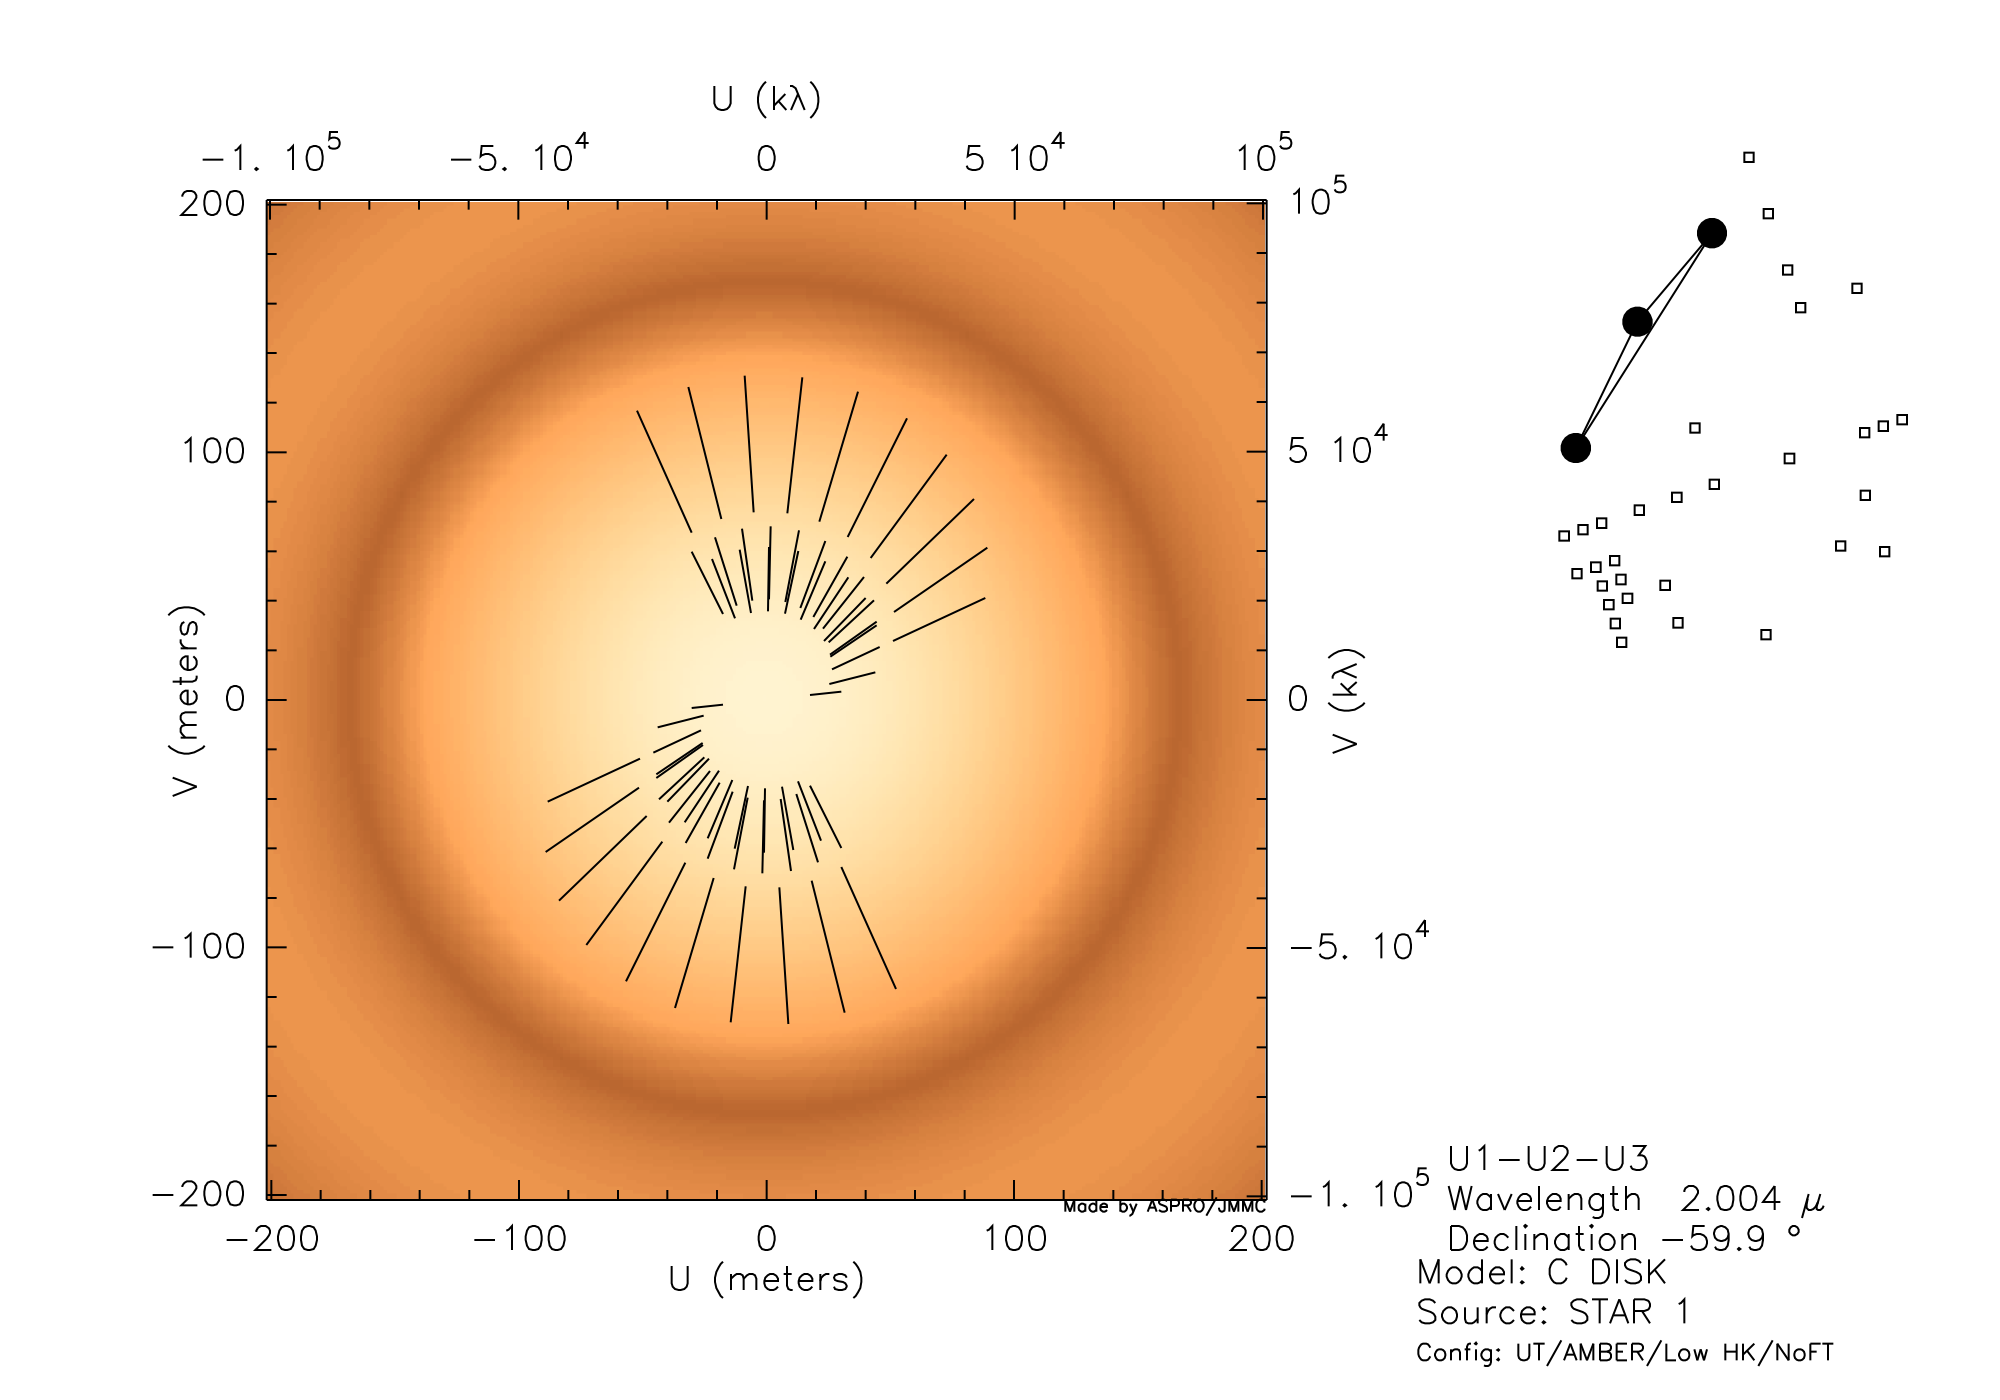
UV tracks
asproUVcoverage.svg
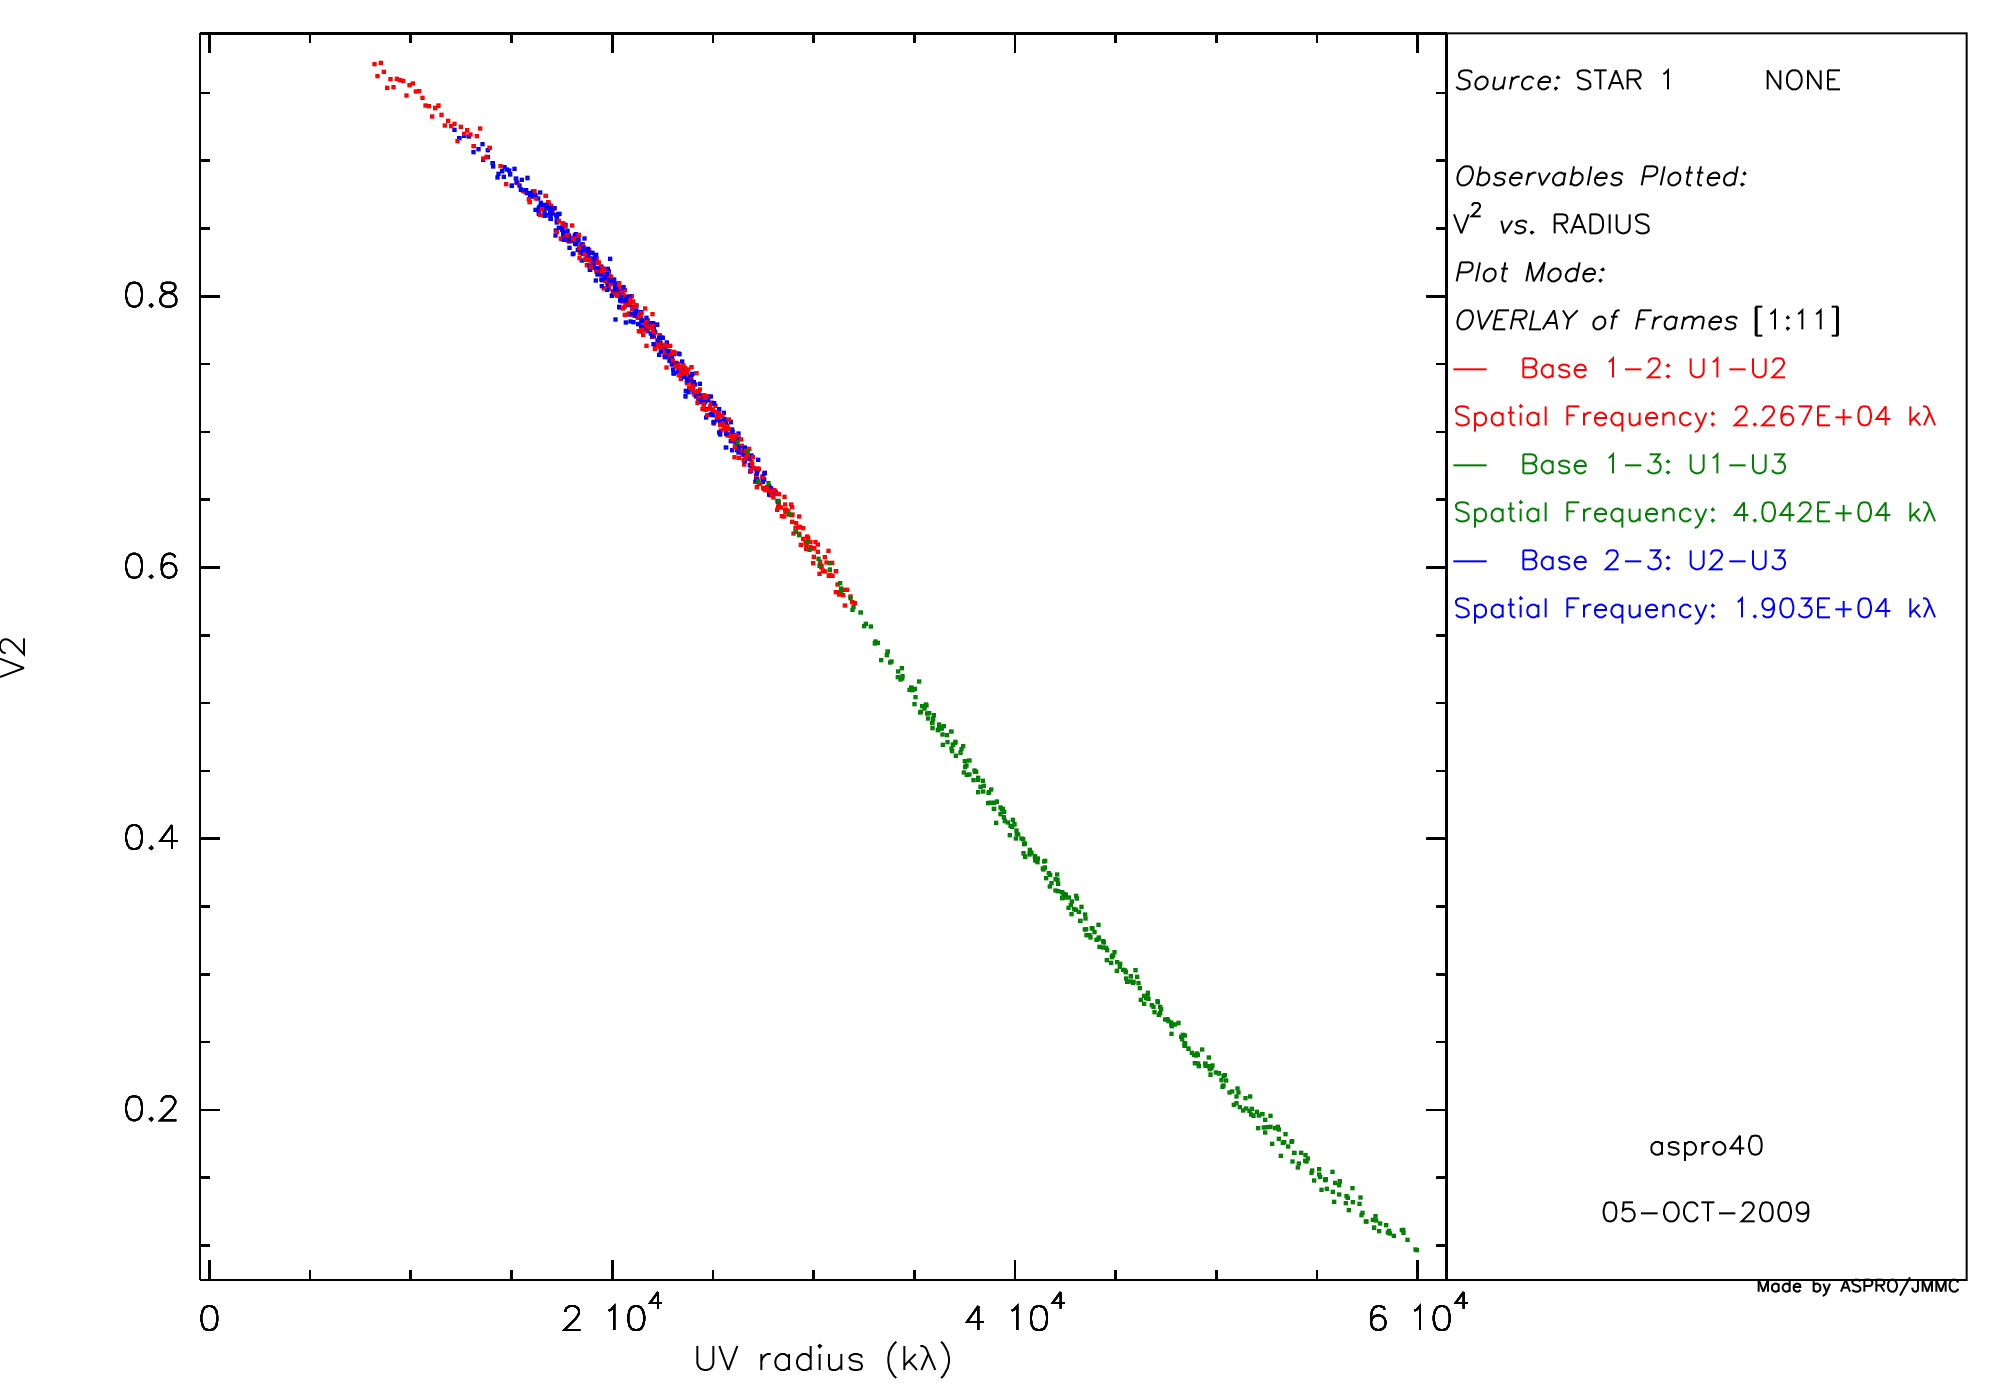
Visibility explorer
For example : Square Visibility vs. Radiusvis2_radius.svg
 -- LaurentBourges - 05 Oct 2009

| I | Attachment | History | Action | Size | Date | Who | Comment |
|---|---|---|---|---|---|---|---|
| |
asproUVcoverage.png | r1 | manage | 253.6 K | 2009-10-05 - 14:15 | LaurentBourges | |
| |
asproUVcoverage.svg | r1 | manage | 99.5 K | 2009-10-05 - 14:15 | LaurentBourges | |
| |
baseLineLimits.png | r1 | manage | 112.2 K | 2009-10-05 - 14:13 | LaurentBourges | baseline limits |
| |
baseLineLimits.svg | r1 | manage | 203.0 K | 2009-10-05 - 14:13 | LaurentBourges | baseline limits |
| |
observability.png | r1 | manage | 58.8 K | 2009-10-05 - 14:00 | LaurentBourges | observability plot (png) |
| |
observability.svg | r1 | manage | 52.6 K | 2009-10-05 - 13:59 | LaurentBourges | observability plot |
| |
vis2_radius.png | r1 | manage | 109.1 K | 2009-10-05 - 14:17 | LaurentBourges | |
| |
vis2_radius.svg | r1 | manage | 343.6 K | 2009-10-05 - 14:17 | LaurentBourges |
This topic: Jmmc/Software > WebHome > JmmcASPRO > JmmcAsproProject > JmmcAsproProjectConception > JmmcAsproProjectPlots
Topic revision: r4 - 2009-10-07 - GuillaumeMella
Ideas, requests, problems regarding TWiki? Send feedback